
Table of Contents
Email Marketing Analytics – Crucial Stats and Metrics
Regular monitoring of your email marketing results is crucial. It's not just about sending emails; it's about continually assessing and enhancing results. Take a closer look at the critical metrics that are essential and should be reviewed routinely.
Table of Contents
Firstly, here’s some good news - most of those stats can be found in our app. You can sign up for free, send campaigns, and easily check the results. It is only the last three metrics that require more technical knowledge and additional tools.
TL;DR
Eight metrics cover almost everything worth knowing about an email program: open rate, clicks and clickthrough rate, bounce rate, list growth rate, complaint and unsubscribe rate, spam rate, conversion rate, and ROI. The first five live in your sending platform. The last three need your analytics tool and your own revenue data.
Open rate is the one to treat carefully. Apple Mail Privacy Protection pre-loads images for Apple Mail users, which registers an open. Whether or not anyone read the message. So, the number in your dashboard is inflated by an amount you cannot see. It is a useful trend line and a poor decision-making metric. Clicks are the reliable engagement signal.
Two numbers are not benchmarks but hard limits: Gmail and Yahoo expect bulk senders to keep spam complaints under 0.10%, and reaching 0.30% gets mail throttled or rejected. Bounce rate deserves the same treatment. It is a deliverability input, not a report card.
Everything else is context. A good open rate for your list is the one it produced last quarter, moved in the right direction. Industry averages tell you whether you are in a plausible range; your own trend tells you whether anything is working.
Open rate
The open rate is a fundamental metric to monitor, indicating the percentage of emails opened versus those unopened. This method is widely adopted for assessing recipient engagement via email. While it's understandable that not every recipient will open your email - achieving a perfect open rate is nearly impossible. It's important to recognize the significance of this metric and strive to improve it.
Truth about open rate
Since Apple introduced Mail Privacy Protection, open rates have not measured quite what they appear to. For recipients using Apple Mail with the feature enabled, images are pre-loaded automatically whether or not the person ever looks at the message. And because open tracking works by loading a small image, those pre-loads register as opens. The result is that your reported open rate includes a share of opens that never happened. And you cannot tell precisely how large that share is.
This is also why published open rate benchmarks vary so widely: some exclude these automated opens and some do not. Treat your open rate as a trend line rather than a measurement. If it moves sharply, something real has changed and is worth investigating. For decisions that matter - settling an A/B test, judging a segment, deciding whether a campaign worked - use clicks, which still require a deliberate action.
How to boost open rate
There are many approaches that can help you to boost this metric. For example - conducting A/B tests, crafting more compelling subject lines, or regaining your customers with re-engagement automation workflow. These are just some of the approaches you should take into account when working to improve your open rate. For further insights into enhancing your open rate, check out this article.
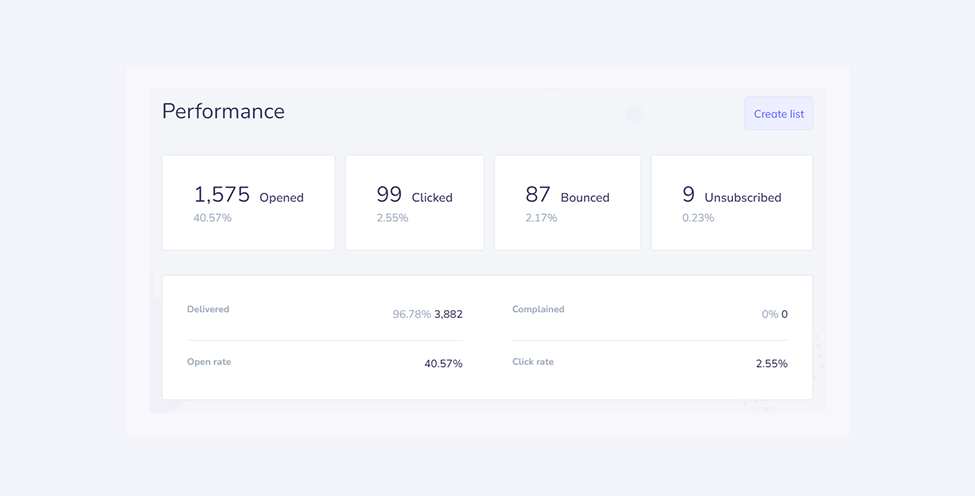
Your purpose for sending will determine how important this metric is on its own. If you're not driving traffic and are instead prioritizing educational content for example, then this metric alone is of the utmost importance. However in many cases, it’s not only critical that your recipients are opening your emails, their interaction with the included content is equally crucial. The subsequent metric will address this inquiry.
Clicks and clickthrough rate
The volume of clicks and the percentage of clickthrough rate (CTR) are key metrics that hold significance for every email marketer. Based on Ascend2 research, 73% marketers rank this metric among the top two most crucial figures associated with emails. That's the proof that CTR is being extremely important.
How to calculate the clickthrough rate
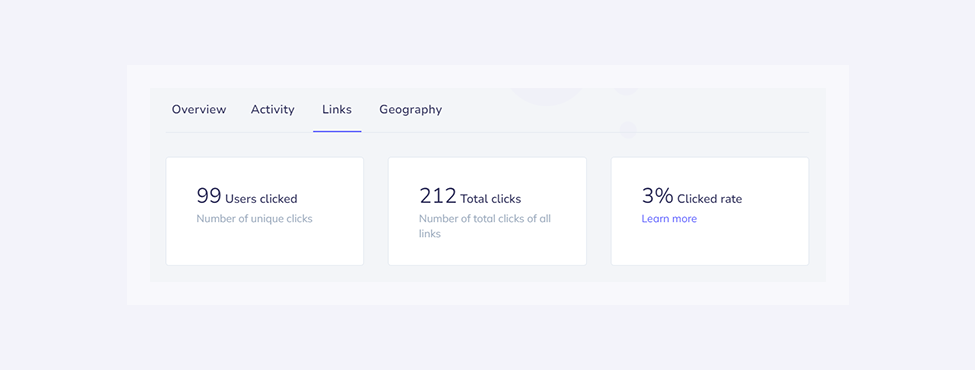
The clickthrough rate (CTR) represents the proportion of email recipients who click on one or more links within a particular email. The calculation method is straightforward: CTR = total (or unique clicks) / number of delivered emails * 100. Utilizing this formula enables you to easily measure the CTR of your campaign. The advantage is that manual calculation is unnecessary. Within our application, you'll find both metrics: unique CTR in reports and the total click tally in the "links" section, for your convenience.
Why clichthrough rate matters more than clicks
Why prioritize CTR over the total number of clicks? The total number of clicks is heavily influenced by the size of the audience. For instance, if you have 10,000 recipients, you might obtain 1,000 clicks, while with 15,000 recipients, you could obtain 1,100 clicks. Despite the higher click count in the second campaign, it doesn't necessarily signify superior performance due to its lower CTR. The first one is more engaging, attracting a more distinct group of users to interact with specific links.
Here are a few recommendations for boosting that rate. Firstly, experiment with various anchor texts to discover the winning formula. Secondly, incorporate images that encourage click interaction, as demonstrated in the example below. Finally, utilize CTA sections to drive traffic to your website.
What makes it so important? It’s arguably the most valuable metric to measure the engagement of your audience. It provides insights into not just the quantity of email readers but also the level of interaction and engagement. While further investigation into recipient actions after clicking is also necessary, we'll address that later on.
Bounce rate
Bounced emails are messages that have been rejected by the recipient server, failing to reach the inbox. While various factors can cause bounces, the most significant one to pay attention to is emails rejected due to being sent to non-existent recipients. These could include invalid email addresses, full mailboxes, or server issues.
How to calculate bounce rate
The calculation is straightforward: bounce rate = (bounced emails ÷ emails sent) × 100. Note that this uses emails sent, unlike clickthrough rate, which is calculated against emails delivered. Mixing the two denominators is a common source of confusion when comparing reports across tools.
Bounce rate benchmarks
Under 2% is the working threshold most senders aim for, and lower is better. It is worth separating the two kinds of bounce when you look at the number. Hard bounces are permanent failures - the address is invalid or no longer exists - and these are the ones that damage your sender reputation, because a list full of dead addresses is a signal mailbox providers read as poor list hygiene. Soft bounces are temporary: a full mailbox, a server briefly unavailable. Those usually resolve on their own and matter far less. A bounce rate that climbs over time is almost always a list quality problem rather than a content problem.
The goal should be to minimize the bounce rate as much as possible, particularly in light of the new mandates from Google and Yahoo, which prioritize low spam and bounce rates for inbox delivery. The importance of contact list hygiene has never been greater. Find out more about the requirements in the following article.
It’s worth noting that there are different categories of bounces. Apart from invalid email addresses, there could be full mailboxes or server issues. You can find out more about all bounce types here and more about how to. Some approaches might lower your bounce rates - find out about effective ways to reduce your email bounce rate in this article.
Growth list rate
The size of your subscriber base is likely another concern you must consider. Hence, the rate at which it increases, termed the list growth rate, plays a pivotal role in determining the success of your email marketing strategy. While there is a basic rule that many marketers follow - a larger audience equals a higher conversion value, the relationship is not always straightforward. Nonetheless, this metric remains relevant and worthy of discussion.
How to calculate that? ([(Number of new subscribers) minus (Number of unsubscribes + email/spam complaints)] ÷ Total number of email addresses on your list]) * 100. Additionally, you can track changes in your list's size on a month-to-month and week-to-week basis.
The growth of your email list is crucial, especially when executing campaigns aimed at acquiring new subscribers. However, it's imperative to avoid sending emails to non-existent recipients. Giving priority to list hygiene and removing inactive audience members goes beyond simply focusing on the number of subscribers.
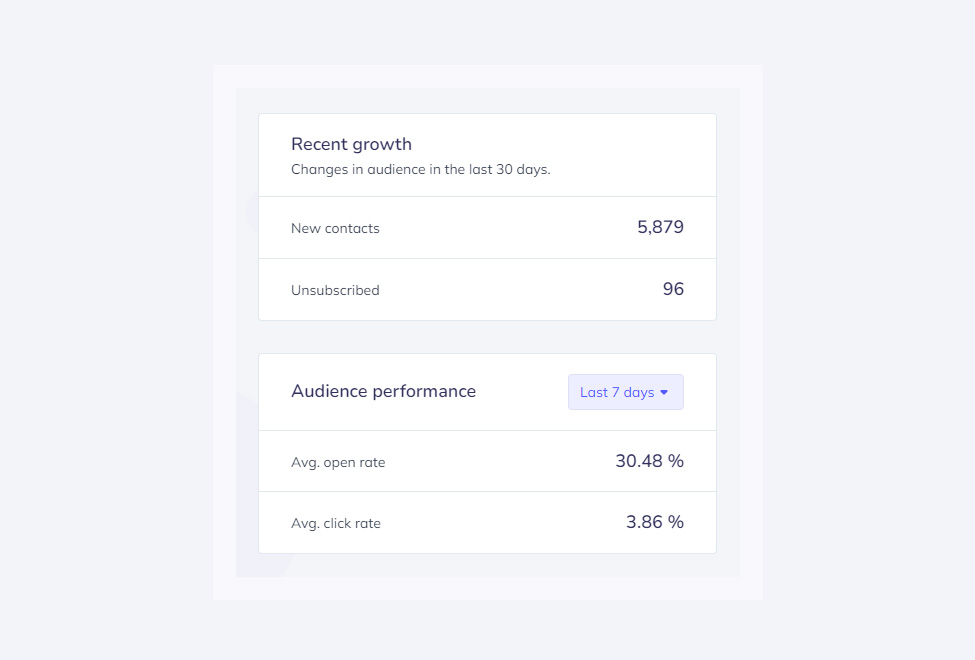
Additionally, it's important to ensure compliance with legal regulations when acquiring new recipients, such as integrating a double opt form.
Complaint and unsubscribe rate
How many users register complaints about your emails or opt out of your list? This information is available in our campaign report. This metric is likely the primary concern for business owners and marketers. How is it measured? By the number of recipients/unsubscribers * 100.
We often wonder: why did these recipients unsubscribe? Is it due to our content? Have they lost interest in our offerings? Each unsubscribed user represents potential lost value for your business, so it's natural to feel concerned and seek to understand the reasons they have unsubscribed.
Yet, if you consistently provide intriguing and stimulating content to individuals who have opted to receive emails from you and whose email addresses were obtained in a lawful manner, then you are in a secure position. With this approach, the unsubscribe rate and complaint rate should ideally hover close to zero.
Spam rate
The spam rate isn't displayed on our dashboard, yet it remains a highly important metric. Evaluate your spam rate using Google Postmaster. This way, you can not only check the spam rate for your domain but also assess your domain reputation.
Unlike most metrics in this article, this one has a published limit rather than a benchmark. Google and Yahoo expect bulk senders - anyone sending more than 5,000 messages a day - to keep the spam complaint rate below 0.10%, and to never reach 0.30%. Those are not targets to aspire to but thresholds with consequences: cross the ceiling and your mail is throttled or rejected rather than flagged for review. Because the numbers are small, they move fast. A single poorly targeted campaign to a cold segment can push a healthy sender over the line in a day.
How to calculated spam complaint rate
The calculation is spam complaint rate = (spam complaints ÷ emails delivered) × 100. Google Postmaster Tools reports it against messages delivered to the inbox rather than messages sent, so the figure you see there is the one that counts against you. It is worth checking after any campaign to a segment you have not mailed recently, rather than only on a fixed schedule.
Although you may not check that metric on a daily basis, it's imperative to avoid spam. How can you achieve this? Authentication of your domain is the crucial initial step, but it's equally important to prioritize list hygiene and ensure the relevance of content sent to your recipients. By implementing these measures, you can maintain a low and satisfactory spam rate.
Conversion rate
Analyzing email statistics is just one piece of the puzzle. You also have the ability to measure the impact of your emails on the actions taken on your website. In doing so, you'll measure not only the clickthrough rate but also the conversion rate. What's the method for measuring this?
To calculate this figure, you'll require more than just our tool. You must also integrate additional analytics platforms such as Google Analytics, PiwikPro, or Matomo. Utilizing these tools, you can analyze the actions performed by recipients who clicked on particular links within your emails.
How to calculate the conversion rate
The formula to count the conversion rate is here: (Number of people who completed the desired action ÷ Number of total emails delivered) * 100
In our tool, you'll find a built-in UTM generator that provides enough functionality for you or your analytics team to measure the impact of emails on your revenue or conversions. It's vital to maintain a cohesive UTM strategy across your entire organization. Ensure that the source, medium, and campaign name are utilized consistently in every email campaign. For detailed reporting and analysis, excel for data analysis here can help you make the most out of your data insights.
In GA4, you'll discover your email campaign results within the acquisition, conversion reports, or explorations. By filtering session source/medium, you can specifically analyze the sessions that originated from emails. Additionally, by navigating to Advertising->all channels, you can evaluate the impact of email campaigns on conversions and campaign revenue through a data-driven attribution model. You can learn more about attribution in GA4 here, as it's a slightly more complex subject.
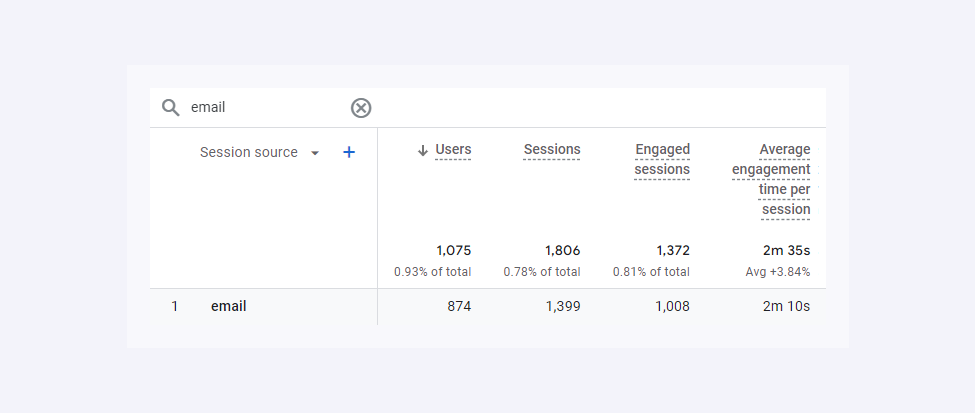
A simpler method for assessing the conversion rate involves tracking the usage of promotional codes. Having exclusive promo codes specifically assigned to your email endeavors enables you to effortlessly track the frequency of code redemptions.
Within the eCommerce and SaaS sectors, the conversion rate reigns supreme as the most critical metric in email marketing.
Overall ROI
If you know your conversion rate and conversion value earned by your email campaigns, you can also earn ROI. This metric is the overall return on investment for your email campaigns. In other words, total revenue is divided by the cost of investment.
The most basic formula to calculate looks like this: [($ in additional sales made minus $ invested in the campaign) ÷ $ invested in the campaign] * 100. Of course, it can differ for different types of businesses.
Running a business without understanding which strategies are profitable and which ones aren't is a certain path to failure. That's why, when implementing an email marketing campaign, it's essential to calculate the ROI to determine whether it's generating revenue or detracting from the business's resources. With the return on investment calculated, you will have proof that email marketing is profitable.
In summary, prioritize achieving high open, conversion, and click-through rates, while also ensuring that spam, bounce, and complaint rates are minimized. For eCommerce businesses, focusing on the conversion rate and ROI is likely most critical. While those sending educational content may find open rates and list growth rate to be more relevant. The key performance indicators (KPIs) associated with these metrics will differ based on your business type. However, it's worthwhile to understand all these metrics even if some may not be crucial for your specific requirements.
Enjoying this Content?
You can receive articles like this straight to your inbox.
Sign up for our newsletter and get a dose of email marketing knowledge every month!
FAQ
If you like this article, share it with friends:


Filip Blajet
Filip is a marketing specialist and content author, who spends a lot of time with data and ads. Outside of work, he loves football, binge watching tv series and travelling.




Eager to put this knowledge to some use?
Try one of our products!


